Every projection you have ever used is built on a season average.
An average cannot tell you an offense has stopped producing.
A salary is a season average wearing a price tag. It is a level, and a level has no direction — it cannot tell you that a team's third quarters have fallen off a cliff, or that a bad offense has quietly been the best one on the slate for three weeks running.
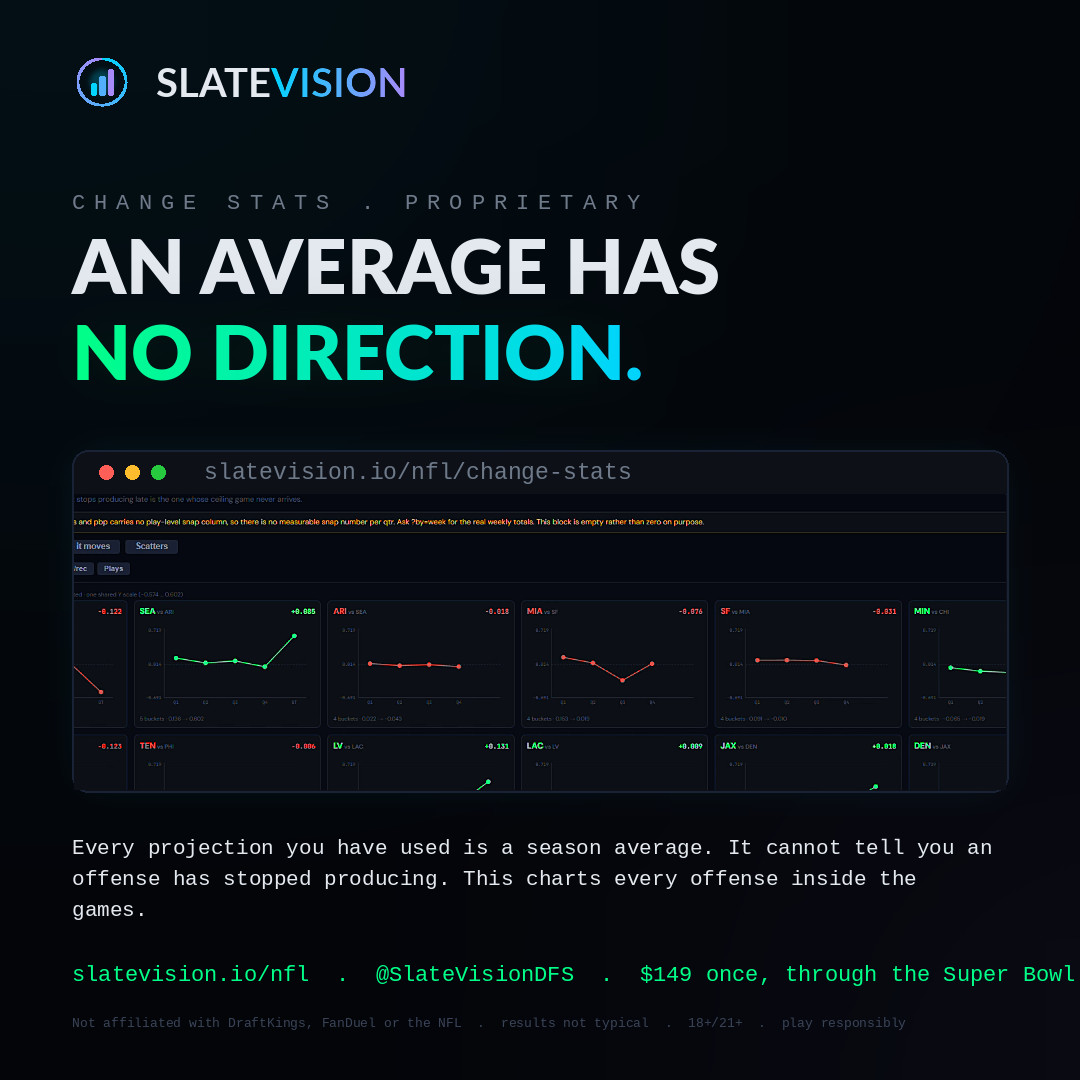
SlateVision charts every offense inside the games — quarter by quarter, drive by drive, down by down — and fits the trend. Then it feeds that trend into 100,000 simulations per player. That gap between the average and the direction is the whole tournament thesis, and it is the part the market prices last.
GET THE NFL SEASON PASS — $149 Show me the change statsWho is climbing. Who is priced on stale production. Where the field is wrong.
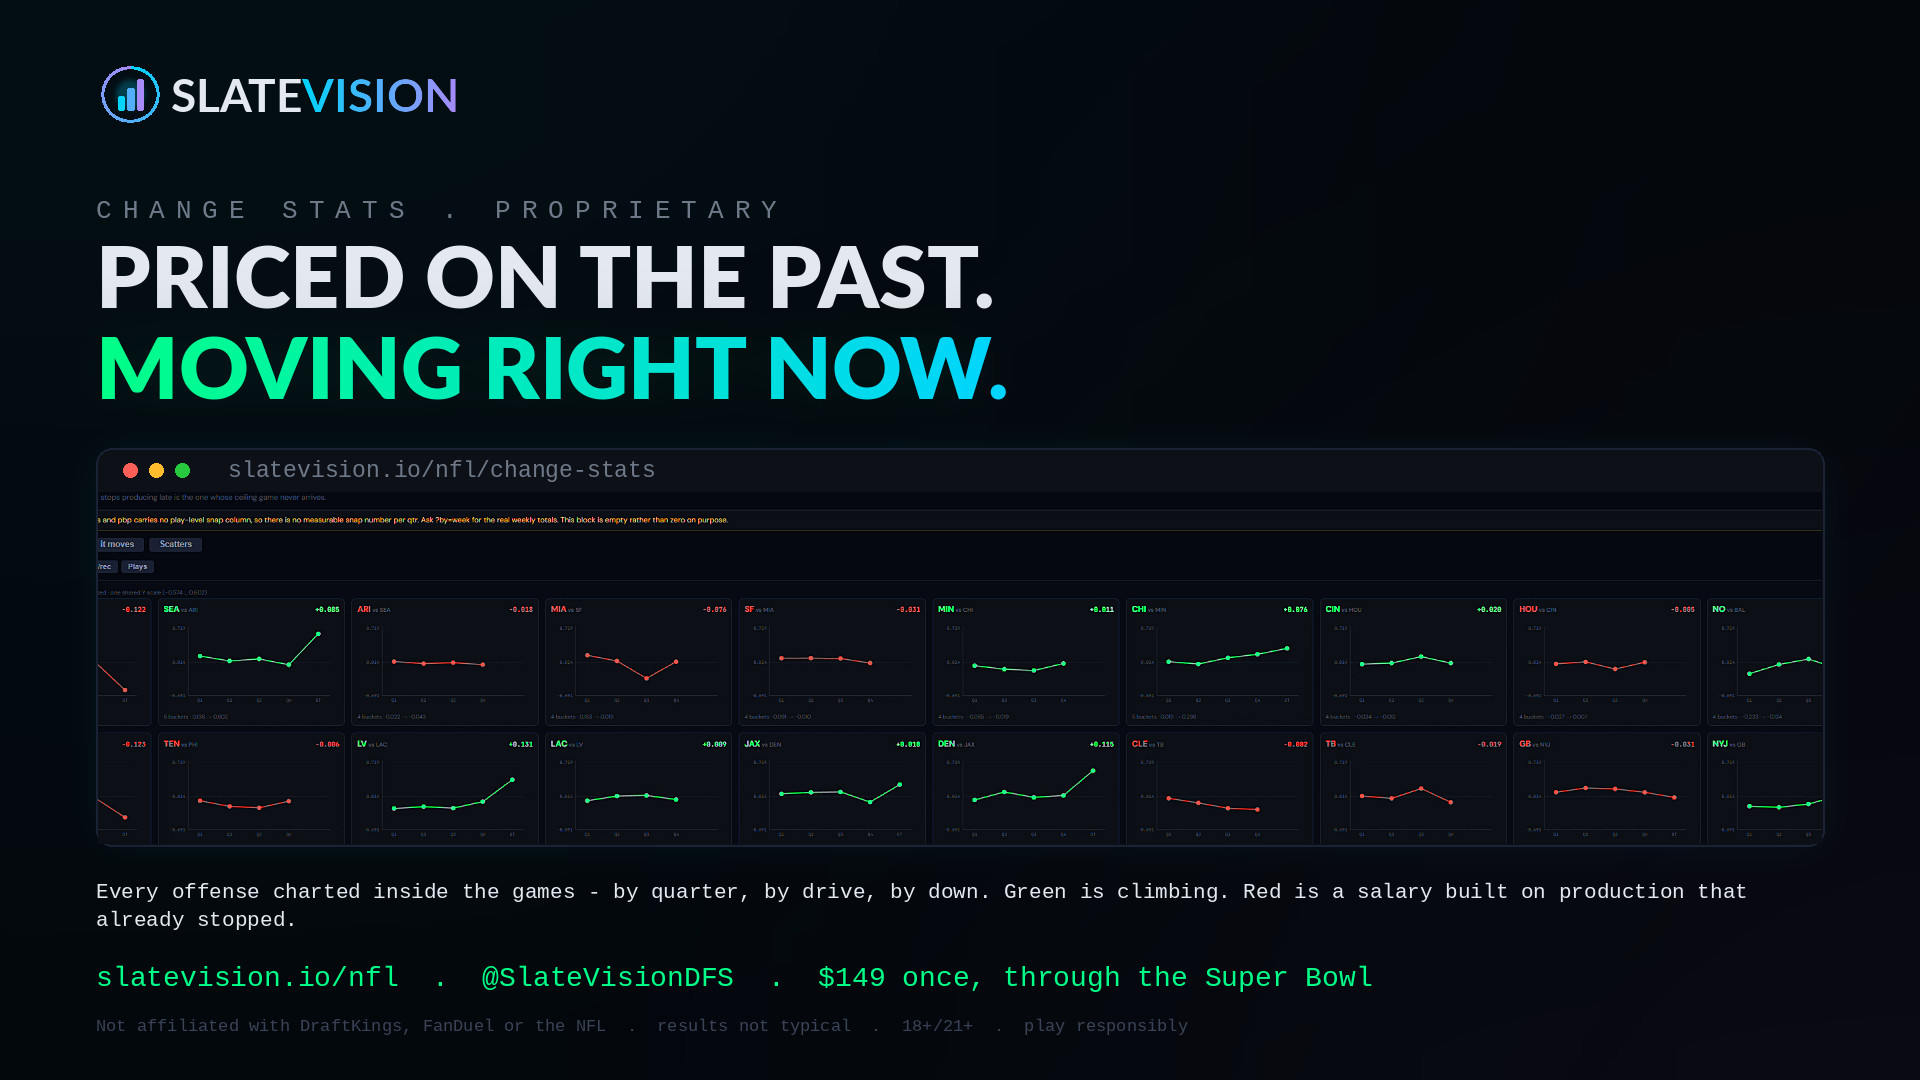
Three questions, one screen, every offense on the slate. The colour is the answer: green is climbing — the field will be here next week, so you need a reason to be here now. Red is fading — the salary is built on production that has already stopped, and that is the leverage buy. Amber is flat.
Five windows, not one
Drive over drive — does this offense start fast and
die, or warm up? One is a first-half correlation play, the other is a comeback stack.
Quarter over quarter — the fade the simulation tails
care about most. An offense that stops producing late never gets you the ceiling game.
Half over half · game over game · by down.
Seven measures, level and trend
EPA per play · success rate · yards per play · pass rate · first-down rate · air yards
per attempt · yards after the catch. Each one twice: where the offense
is, and where it is
going.
Heat-scaled against the other teams playing today —
not against a 32-team leaderboard you cannot act on.
⚠ It refuses to fake it
A bucket under ten plays is dropped rather than rated
on noise. A trend needs three buckets — two points
define a line and prove nothing.
Below that the cell is blank, and blank means the
model declined to guess. It is never a zero. Every screen in this app is tested against
that rule.
And it does not stop at the team. Who it moves puts one row per rosterable player carrying his own offense's level and trend — so "this offense has stopped producing" stops being a talking point and becomes this $7,200 receiver is priced on production that ended three weeks ago.
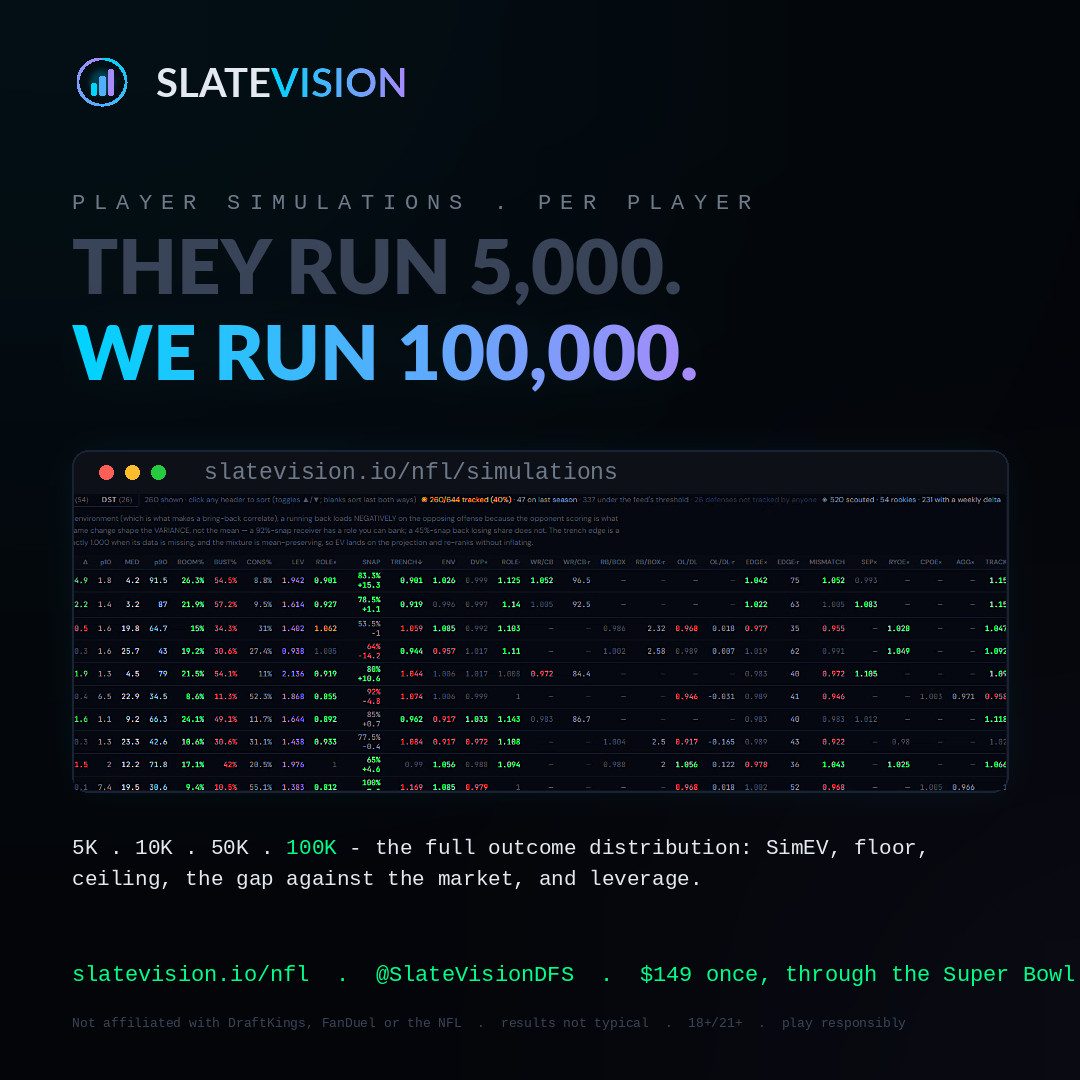
100,000 sims. With the things that actually move a Sunday in them.
A big iteration count is worthless if the inputs are thin. SlateVision runs up to 100,000 outcomes per player, on every slate, for every pass holder — and every one of these is inside the model, not bolted on beside it:
Role & workload
Depth-chart position, snap share, target and carry share — who is getting the work now, not who got it in September.
The matchup
Defense-versus-position feeding the ceiling directly, so a soft spot widens the top of the distribution rather than nudging the mean.
Game environment
Implied team total, spread and pace, centred on this slate — a 27-point total means something different in a 13-game window than a 2-game one.
Tracking data
Separation, cushion, air yards, time to throw, pressure rate — matched player by player, with the coverage count printed honestly.
The trenches
Pressure allowed and pressure generated, signed the right way round for both sides. A quarterback behind a leaking line is a different distribution.
Availability
Confirmed starters, inactives, and the work that gets vacated when somebody is ruled out — redistributed to the player who actually inherits it.
What comes back is a shape, not a number: SimEV, floor, ceiling, the gap against the market projection, and leverage against projected ownership — sortable columns in the player pool, so you build from the distribution.
Everyone sells you the number. We show you the slate.
A projection is one number with an argument hidden behind it. Every screen here draws the argument. Scatter walls on every position group. A mismatch grid for the trenches. Coverage bars with the league average drawn on them, so you can see at a glance which side of it a defense sits on. All of it heat-scaled against the teams playing today.
Sweat the slate on one screen.
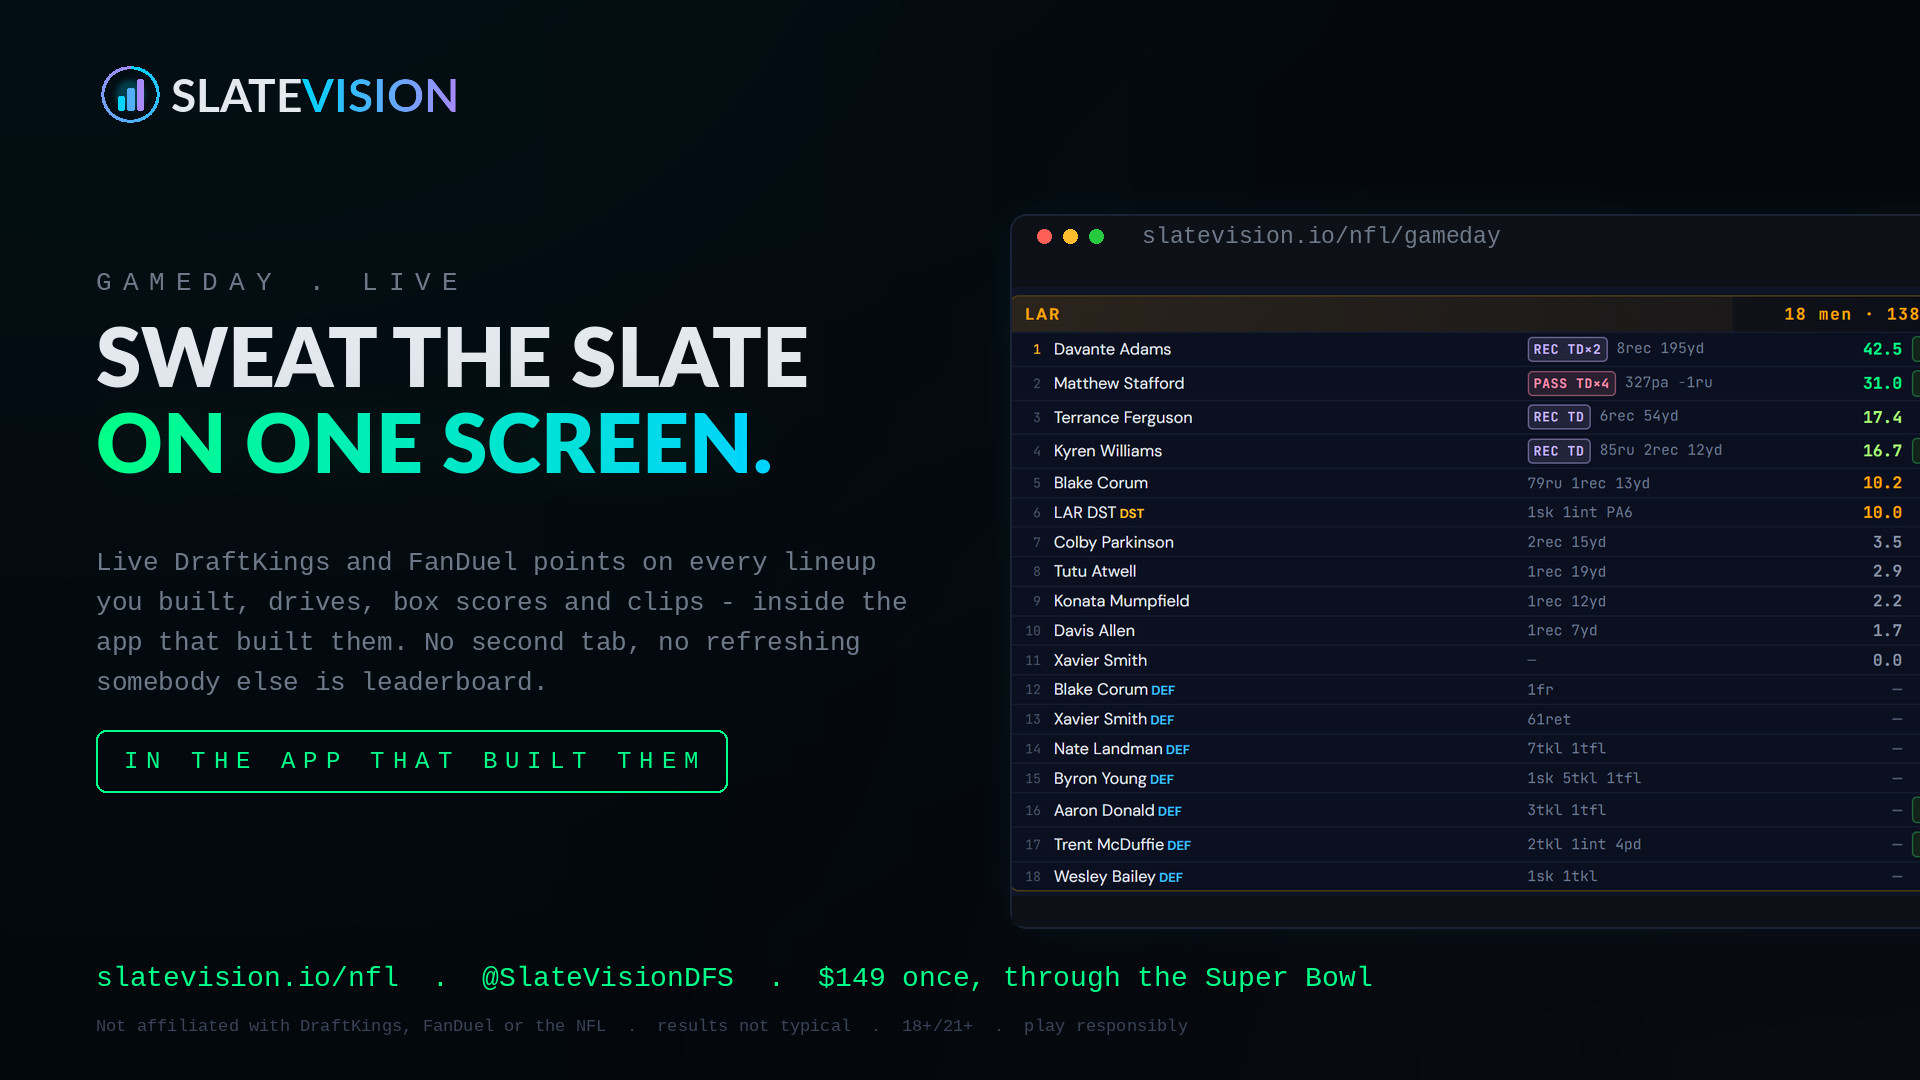
Sunday at 1pm is the part every optimizer abandons you for. Gameday is a live command centre: real-time DraftKings and FanDuel points on every lineup you built, the scorebug, drive by drive, advanced box scores and condensed video — in the app that built the lineups. No six tabs, no phone in one hand and a spreadsheet in the other.
Each lineup shows what it was projected to do and what it is actually doing, seat by seat, with the players still to come marked as still to come — not silently counted as zero.
Worth the pass on its own.
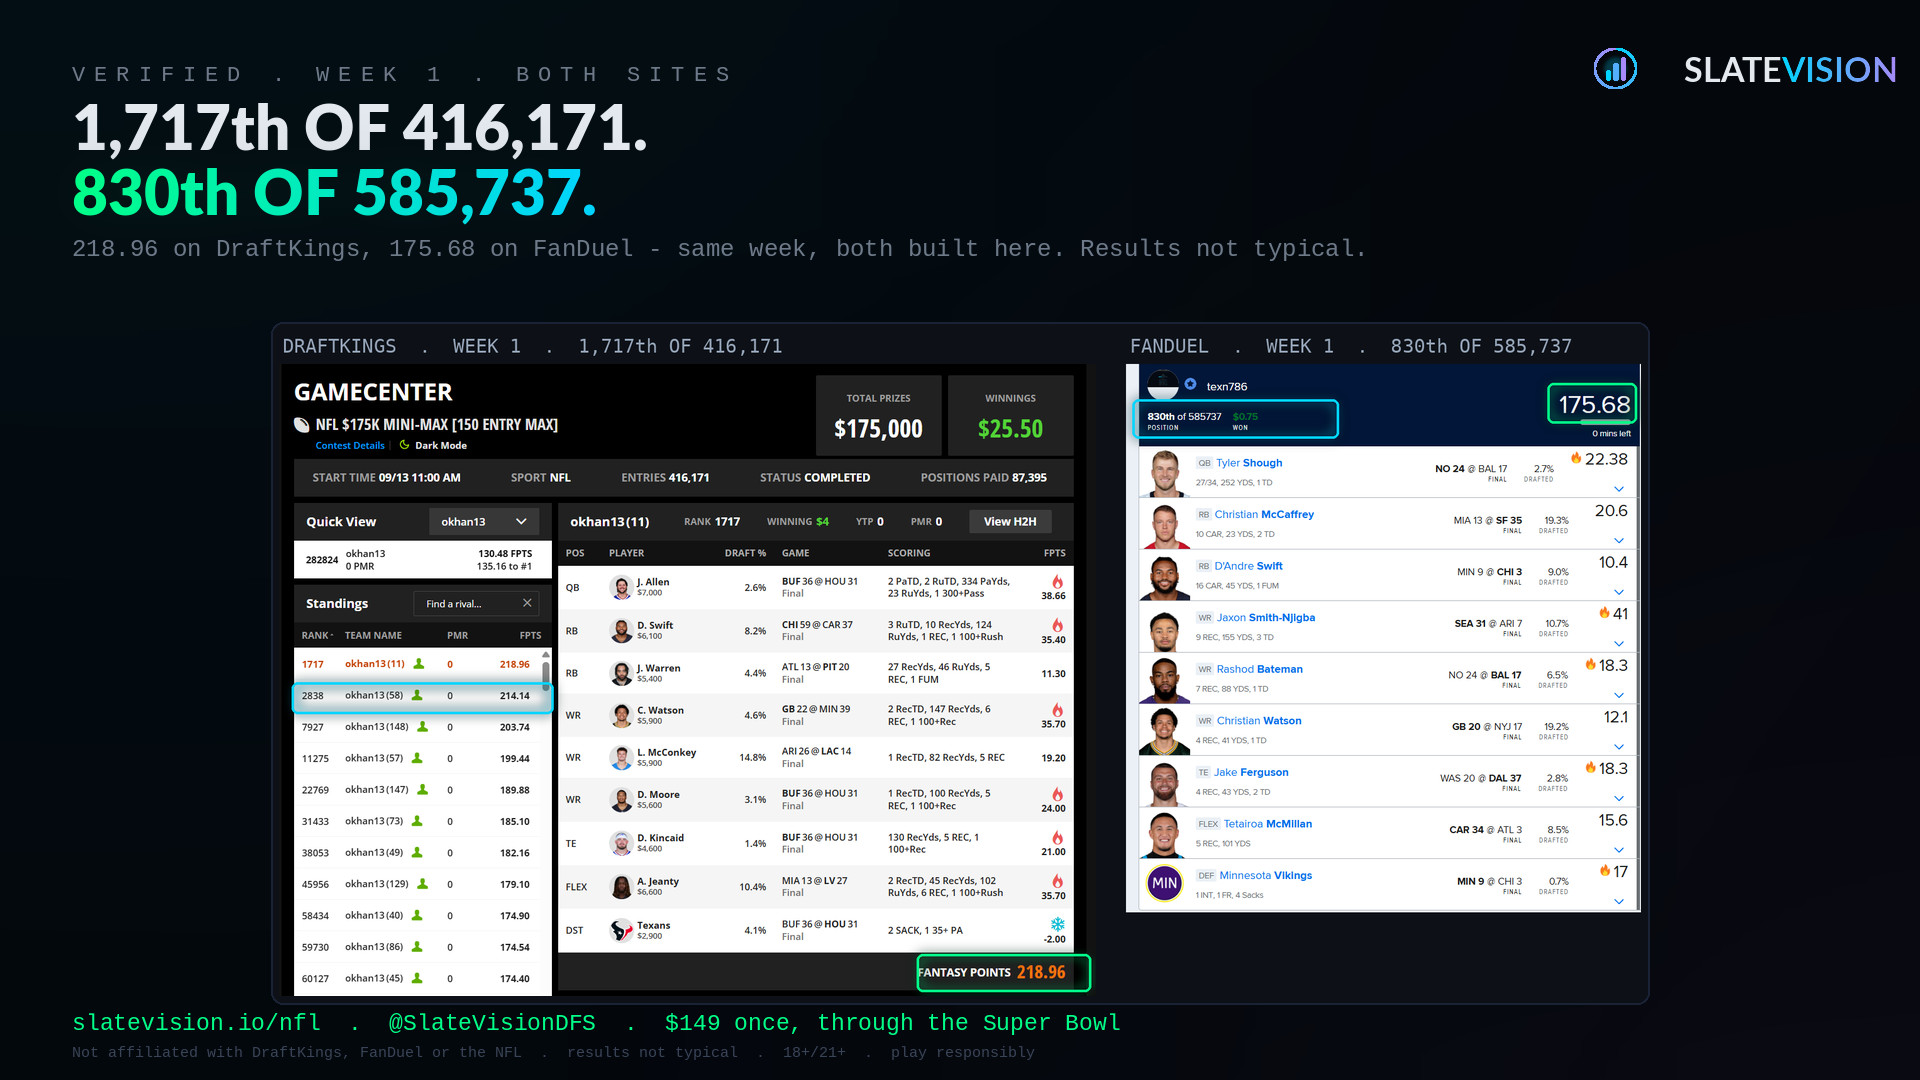
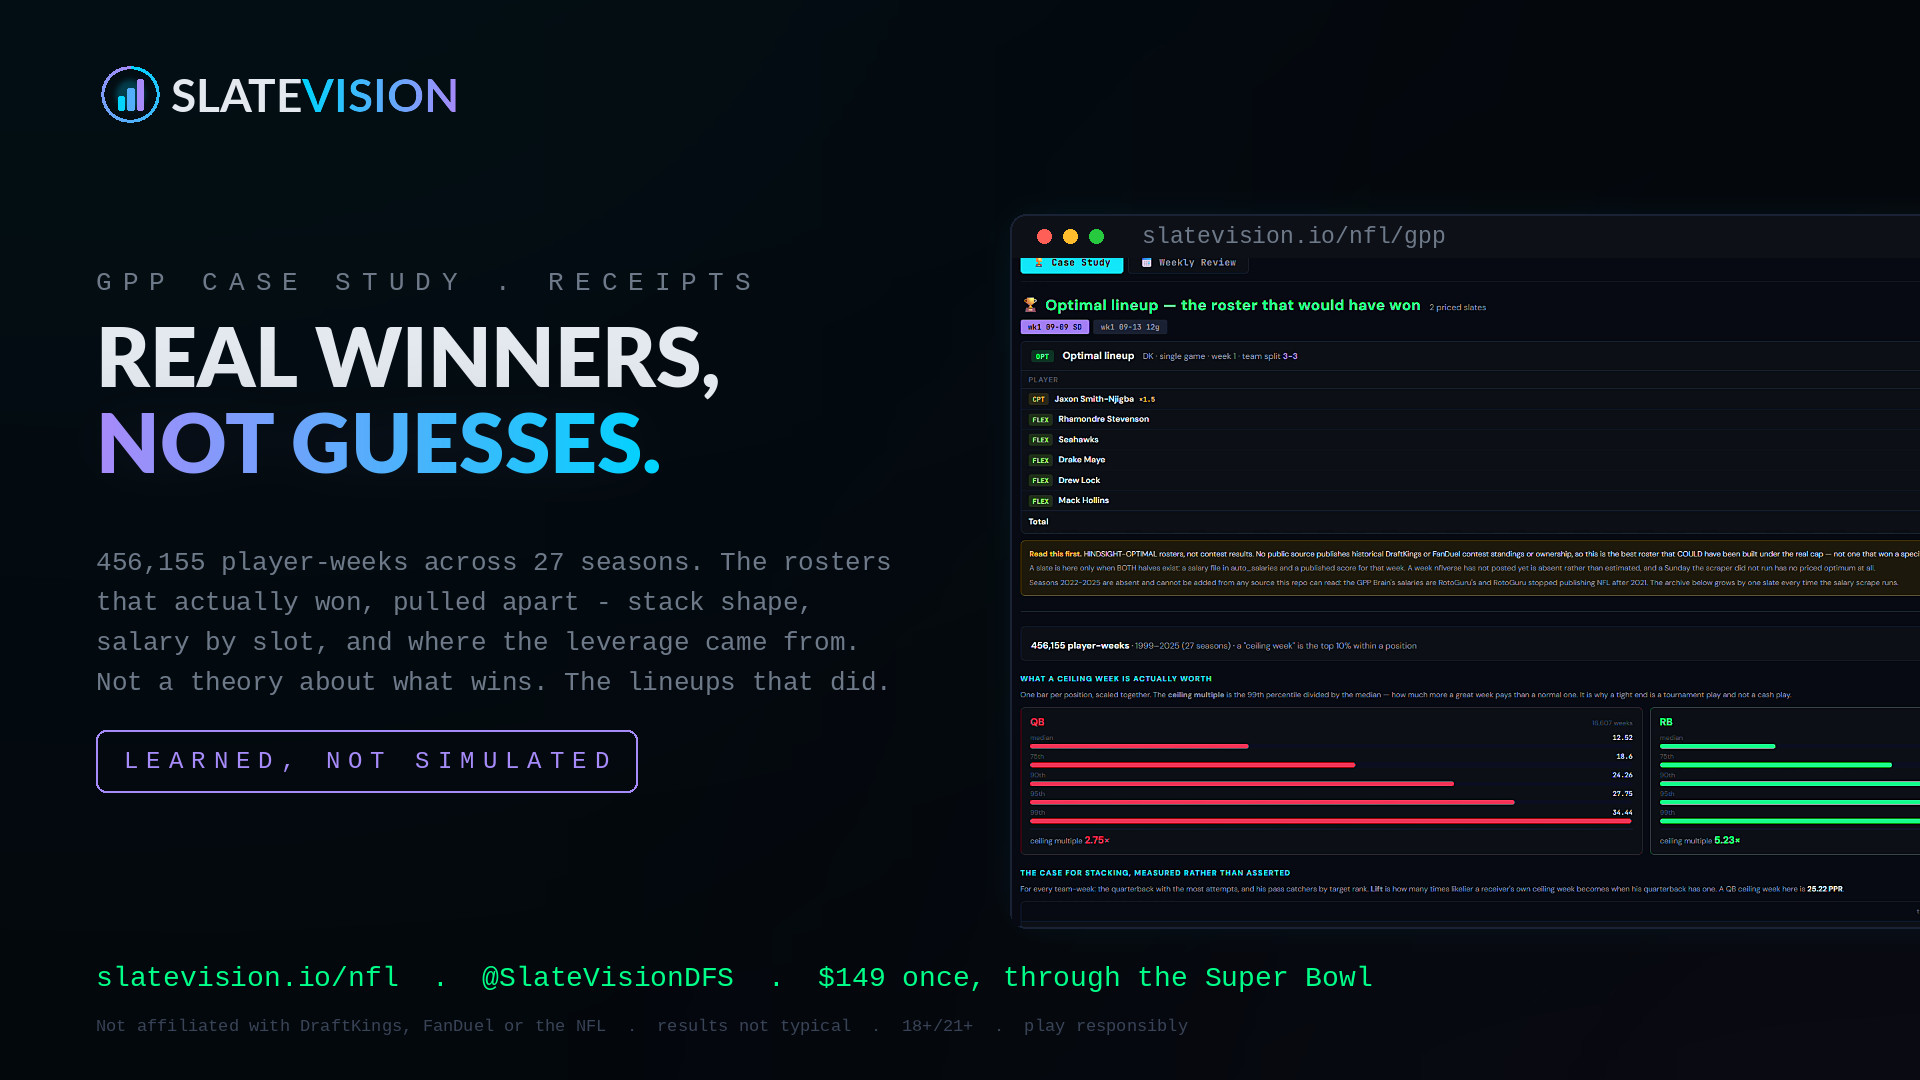
Everyone has a theory about how a tournament is won. This tab has the lineups. Real winning rosters from real scored slates, pulled apart: the stack shape, the salary spent at each slot, how much was left on the table, where the leverage came from, what the field was on and what the winner was on instead.
Not theory, and not synthetic — receipts, sorted. Ask what winning rosters looked like on a slate shaped like this one and get an answer with a date on it. Plenty of people would pay $149 for this tab alone. It is one of twenty-six.
Twenty-six tabs. One price. No tiers.
Nothing below is an add-on, an upsell or a "pro" unlock. It is what the pass is.
Build
- ✓ Player Pool with the lineup builder beside it
- ✓ Both salaries and both team/game filters on every positional pool
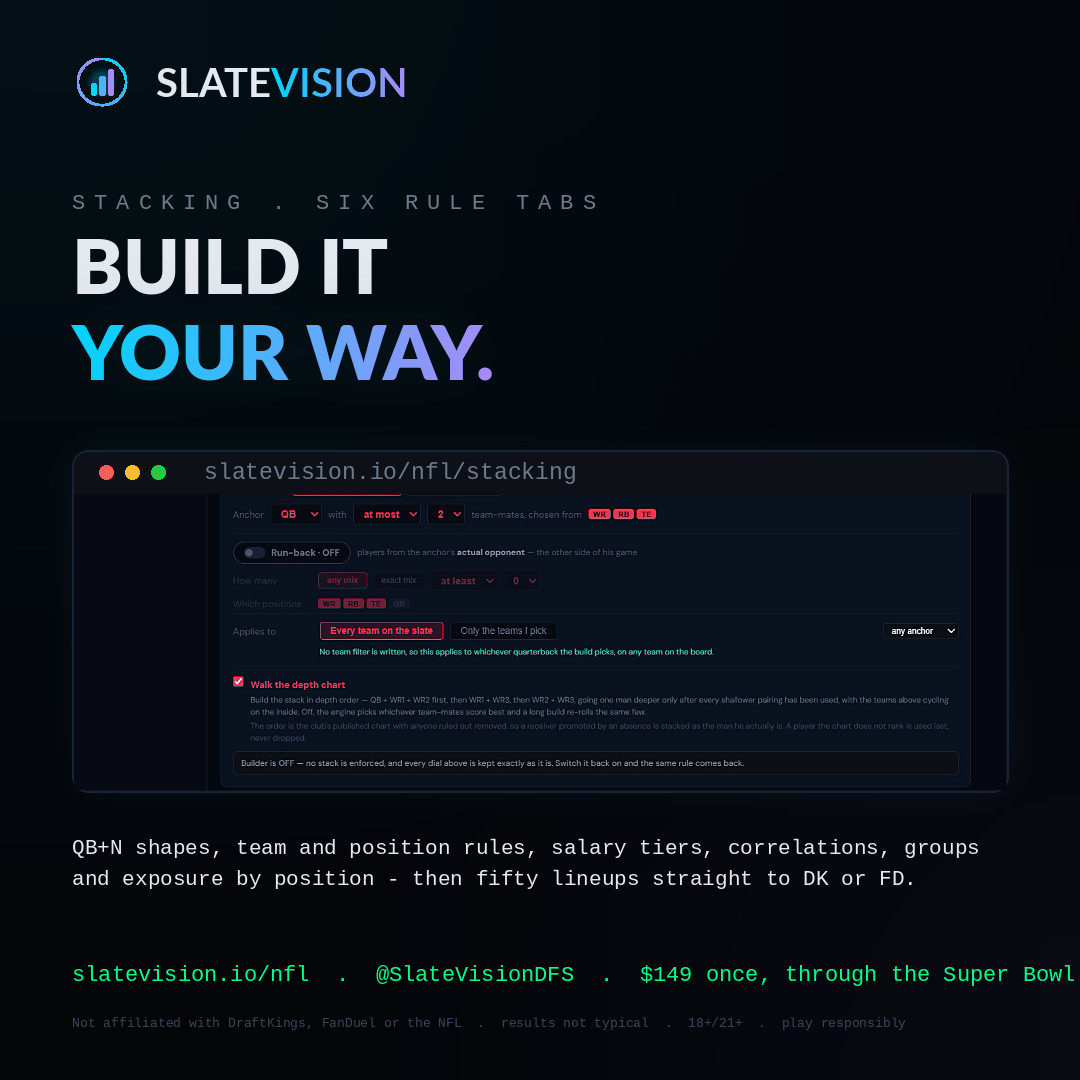
- ✓ Stacking — correlation-aware team stack builder
- ✓ Min and max exposure per player, honoured to the lineup
- ✓ A salary floor that is honoured — set 49,600 and every lineup clears it
- ✓ Groups, locks, removals, MME builds
- ✓ Classic and Showdown, captain pricing done right
- ✓ DraftKings and FanDuel, including FanDuel id assignment for upload
- ✓ Saved and Deleted lineup sets that survive the session
Know
- ✓ 📈 Change Stats — the trend engine above
- ✓ Simulations — up to 100,000 per player
- ✓ Matchups — the mismatch grid
- ✓ QBs · RBs · WRs · TEs · FLEX · DST, each with its own scatter wall
- ✓ 📊 All Positions — fourteen cross-position plots
- ✓ O-Line and ⚔️ D-Line vs O-Line
- ✓ 🛡 WR/CB · RB/LB — coverage and box, down to the defender
- ✓ Depth Chart — availability-adjusted, starters marked
- ✓ Team Compare, Vegas splits and weather
- ✓ 🥇 Top UTIL · 🥇 Top Stacks leaderboards
Watch
- ✓ 🎮 Gameday — live DK + FD points on your lineups
- ✓ Scorebug, drives, advanced box scores, condensed video
- ✓ Pre- and post-results on every lineup you built
- ✓ 🏆 GPP Case Study — real winning rosters
- ✓ 🎥 CV Model — tracking analytics derived from film
- ✓ Installs to your phone — the same app, on the couch
A missing value is a dash or an error. It is never a zero.
A zero that means "we did not measure this" is the most expensive lie a DFS tool can tell you, because it looks exactly like a player who did nothing. Every screen here is tested against that rule — and a measured zero still shows as zero, because that one is real.
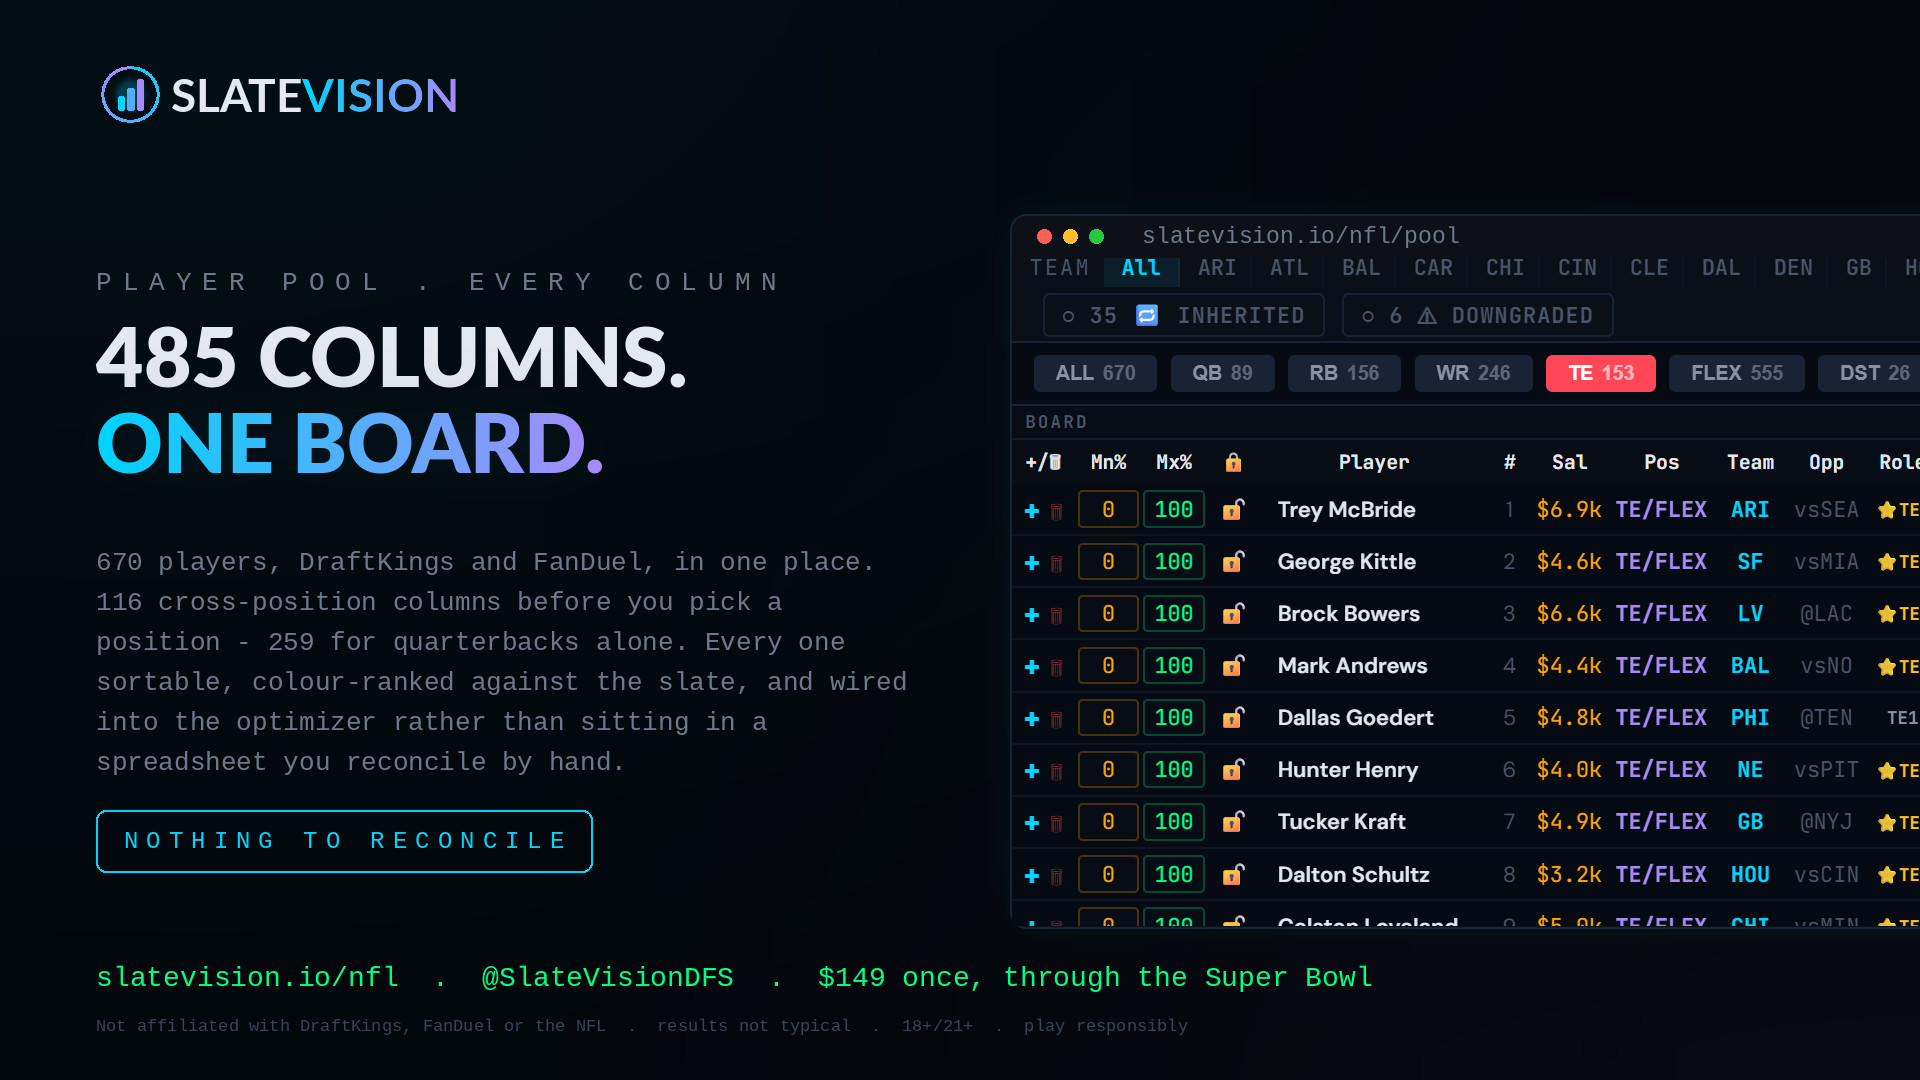
Most products sell you a table. This is 485 columns, and a model that uses them.
The cross-position board carries 116 columns before you pick a position. Choose one and the set swaps to that position's own: 259 for quarterbacks alone. Football metrics are position-specific, so targets and carries only mean something once a position is chosen — and every one of them is sortable, colour-ranked against the slate, and wired into the optimizer rather than sitting in a spreadsheet you have to reconcile by hand.
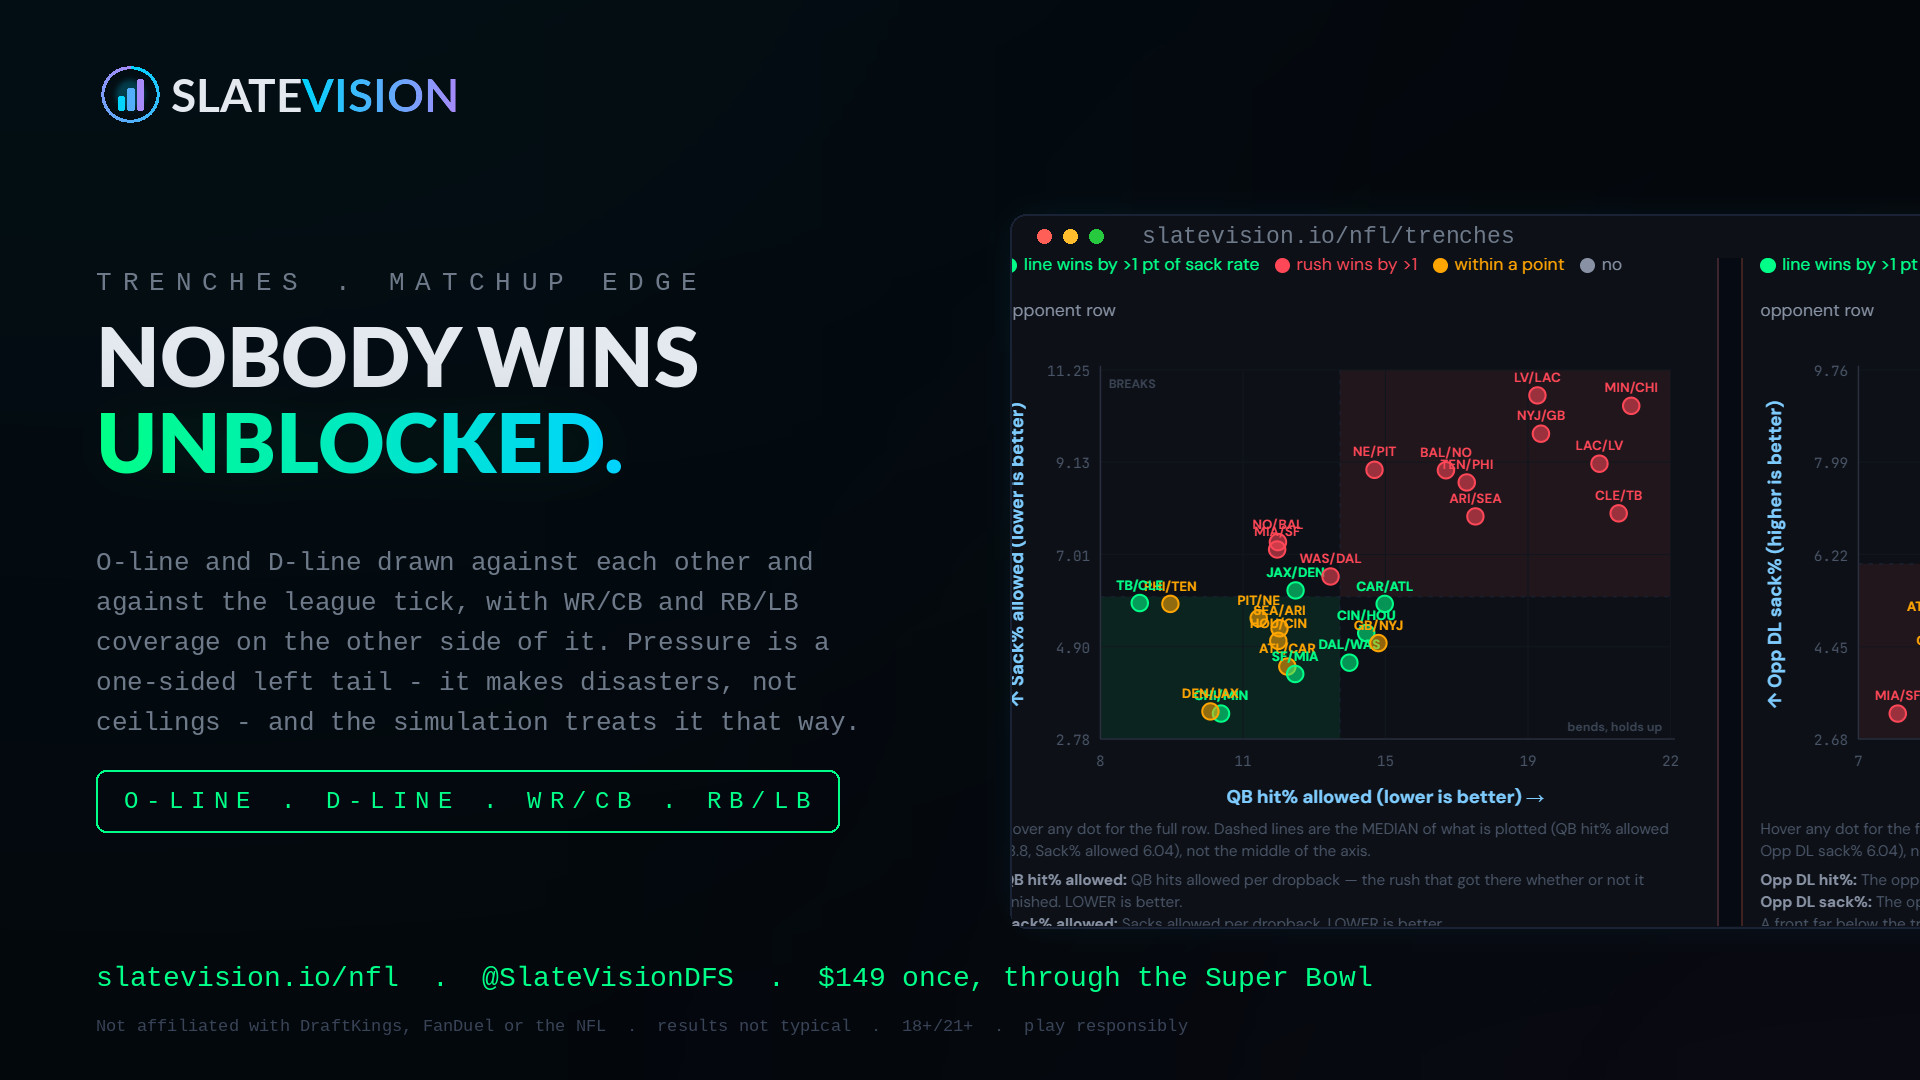
The trenches, both sides
O-Line — pressure allowed, sack rate, yards before
contact, blown-block rate.
D-Line vs O-Line — the two drawn against each other
and against the league tick, so the mismatch is a picture, not a guess. Pressure is a
one-sided left tail: it creates disasters, not ceilings, and the sims treat it that way.
Coverage, man for man
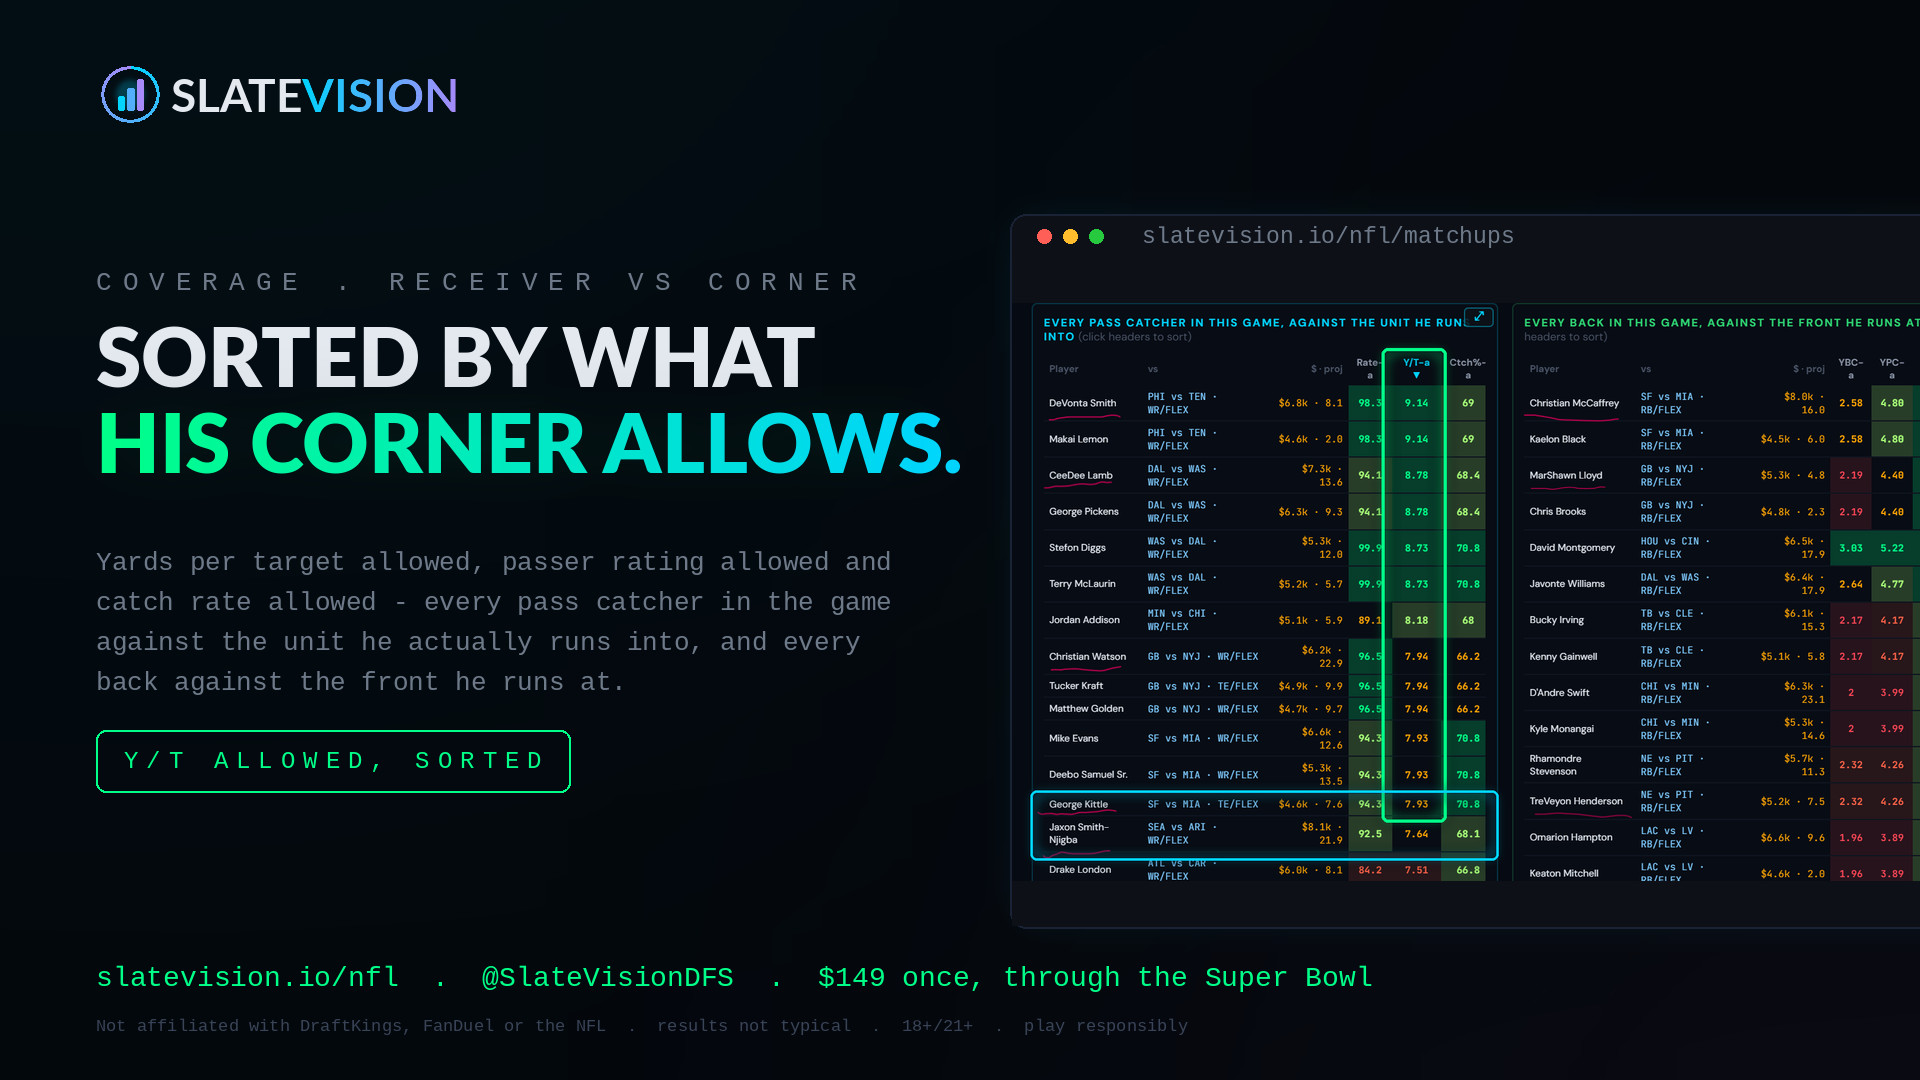
WR/CB and RB/LB — who each receiver actually runs against, with separation, cushion, target share and targets allowed by position on the other side of it. Plus the scouting layer: speed, acceleration, agility, awareness, route type, slot rate.
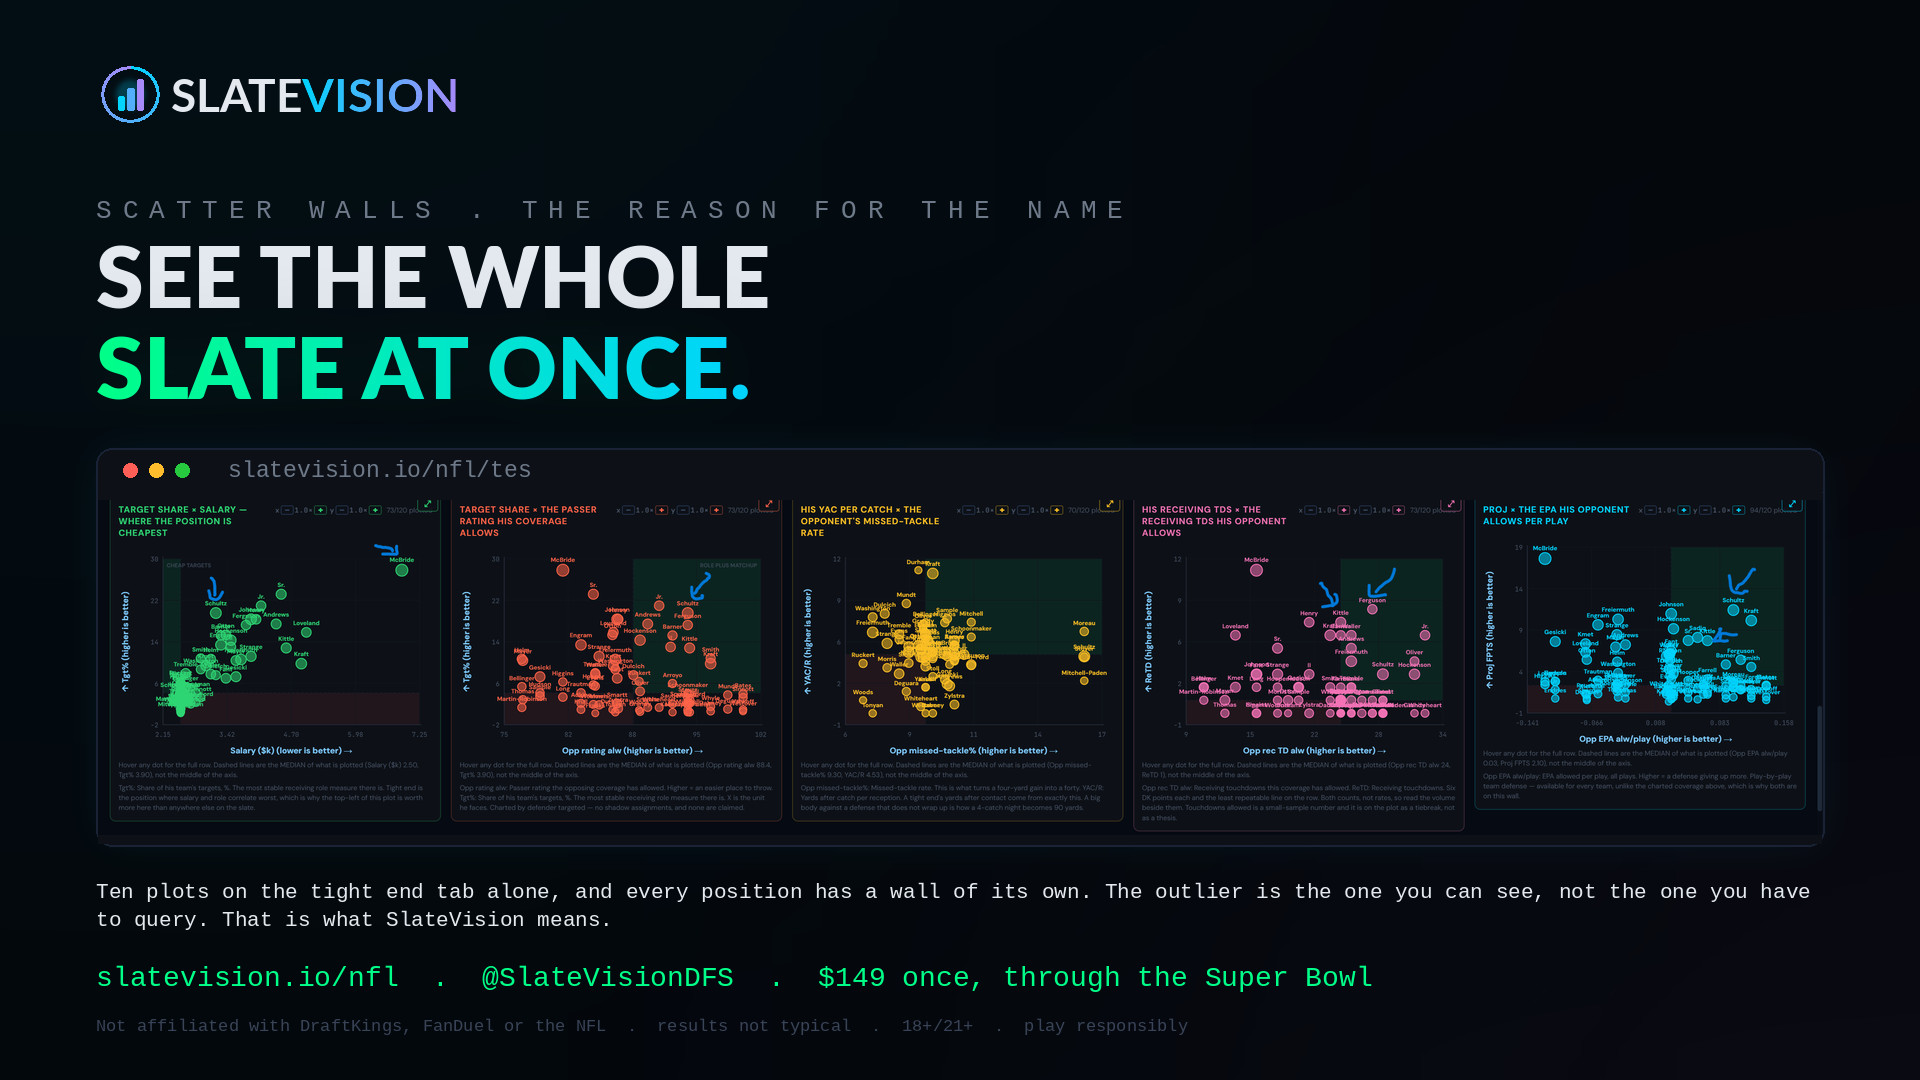
The scatter walls — the reason for the name
Ten plots on the tight end tab alone, and every position has a wall of its own — plus twenty more on All Positions. Ceiling × salary, separation × direction, EPA per target × YAC, target share × the passer rating his coverage allows. Every plot is the whole slate at once, so the outlier is the one you can see rather than the one you have to query. That is what SlateVision means.
Every slate. The ones that already ran, and the next one.
Every board that has run this season stays in the app — Main, Primetime and Showdown, on both sites, back through the summer. You can open a slate that has already been graded and study what the model said before it happened, which is the only honest way to learn a tool. And the next slate is live the moment the salary file posts: projections, sims and the full column set are already on it, so you are never waiting on somebody's upload schedule to start working.
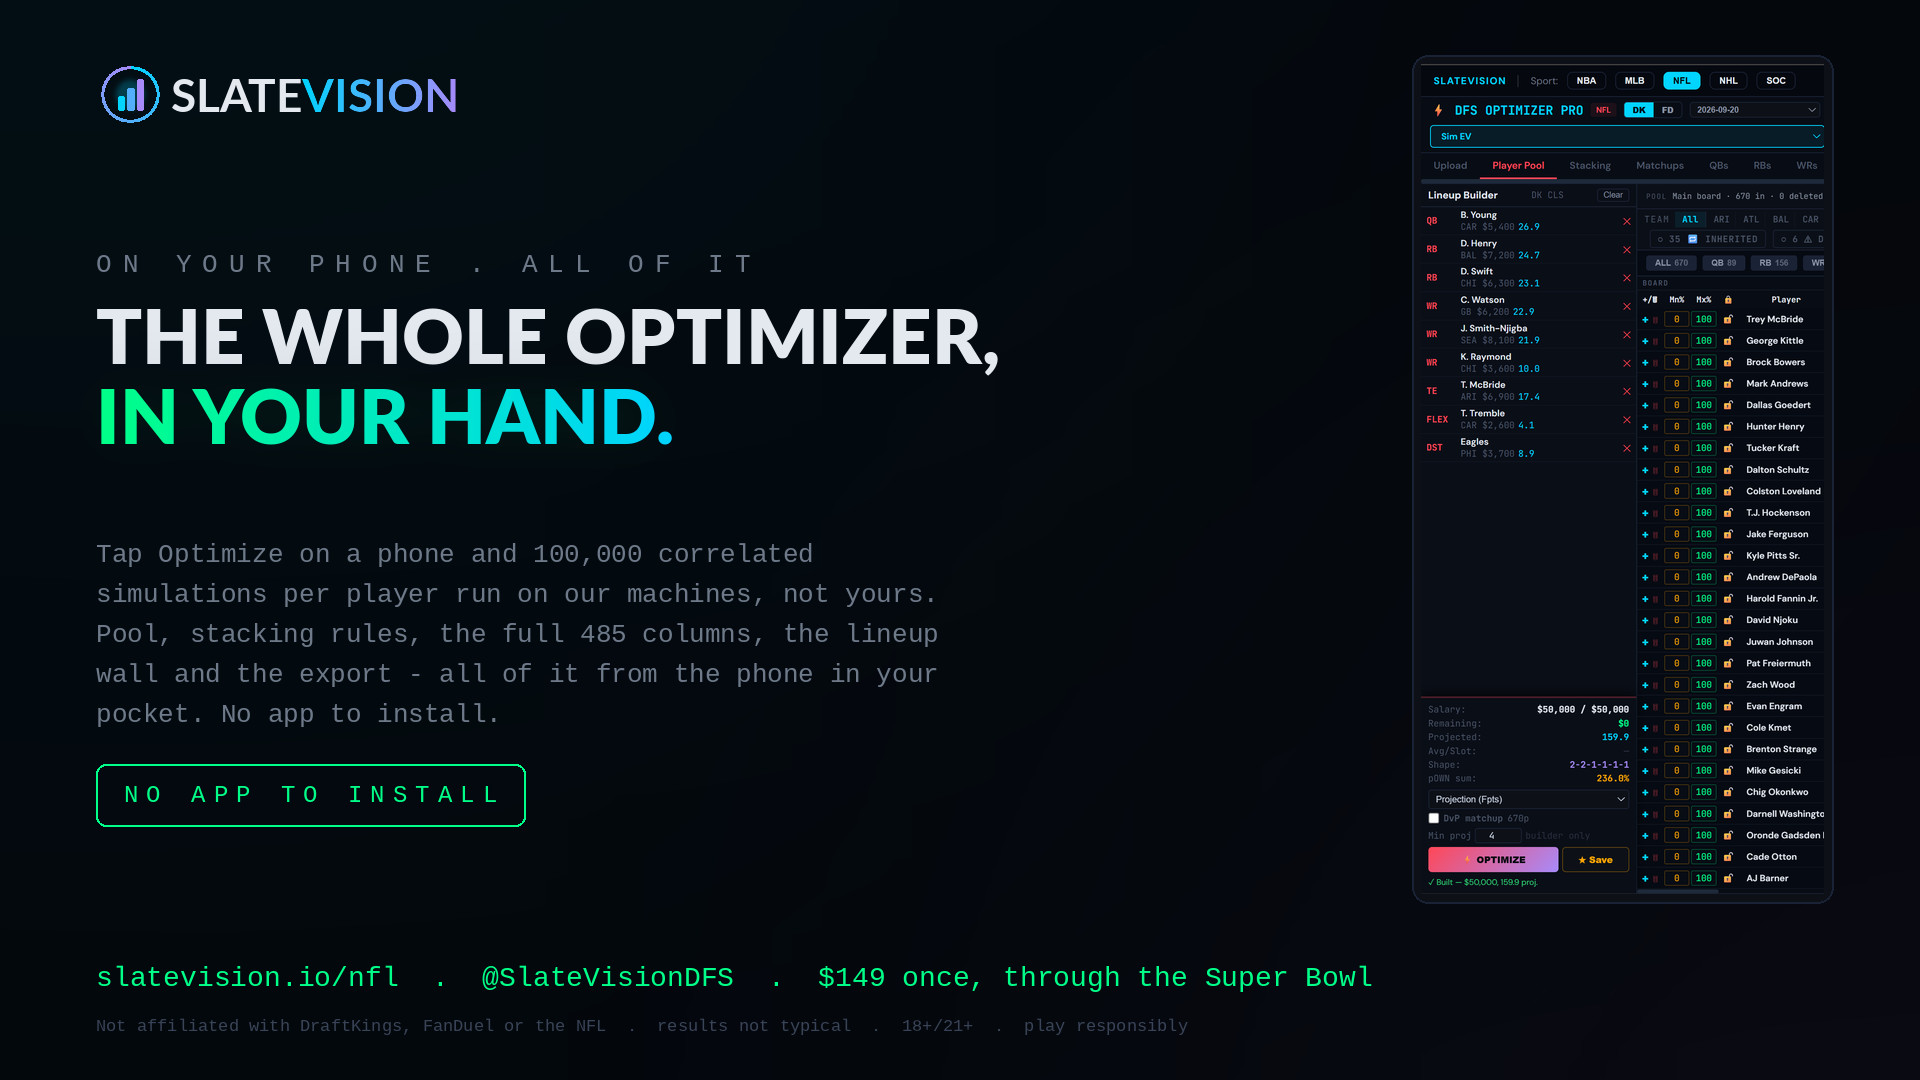
The whole optimizer, in your hand.
Every optimizer we have used asks you to be at a desk. SlateVision does not. The player pool, the stacking rules, the simulations, Optimize, the lineup wall and the export all work from a phone browser — the same app with the same columns, laid out for a narrow screen instead of cut down for one. Nothing to install, nothing to sync, no companion version that is missing the thing you need.
Which matters most on the days it matters most: news breaks at 12:40, you are not at your desk, and you still want to swap a player, re-run it and re-export before lock.
Build it there
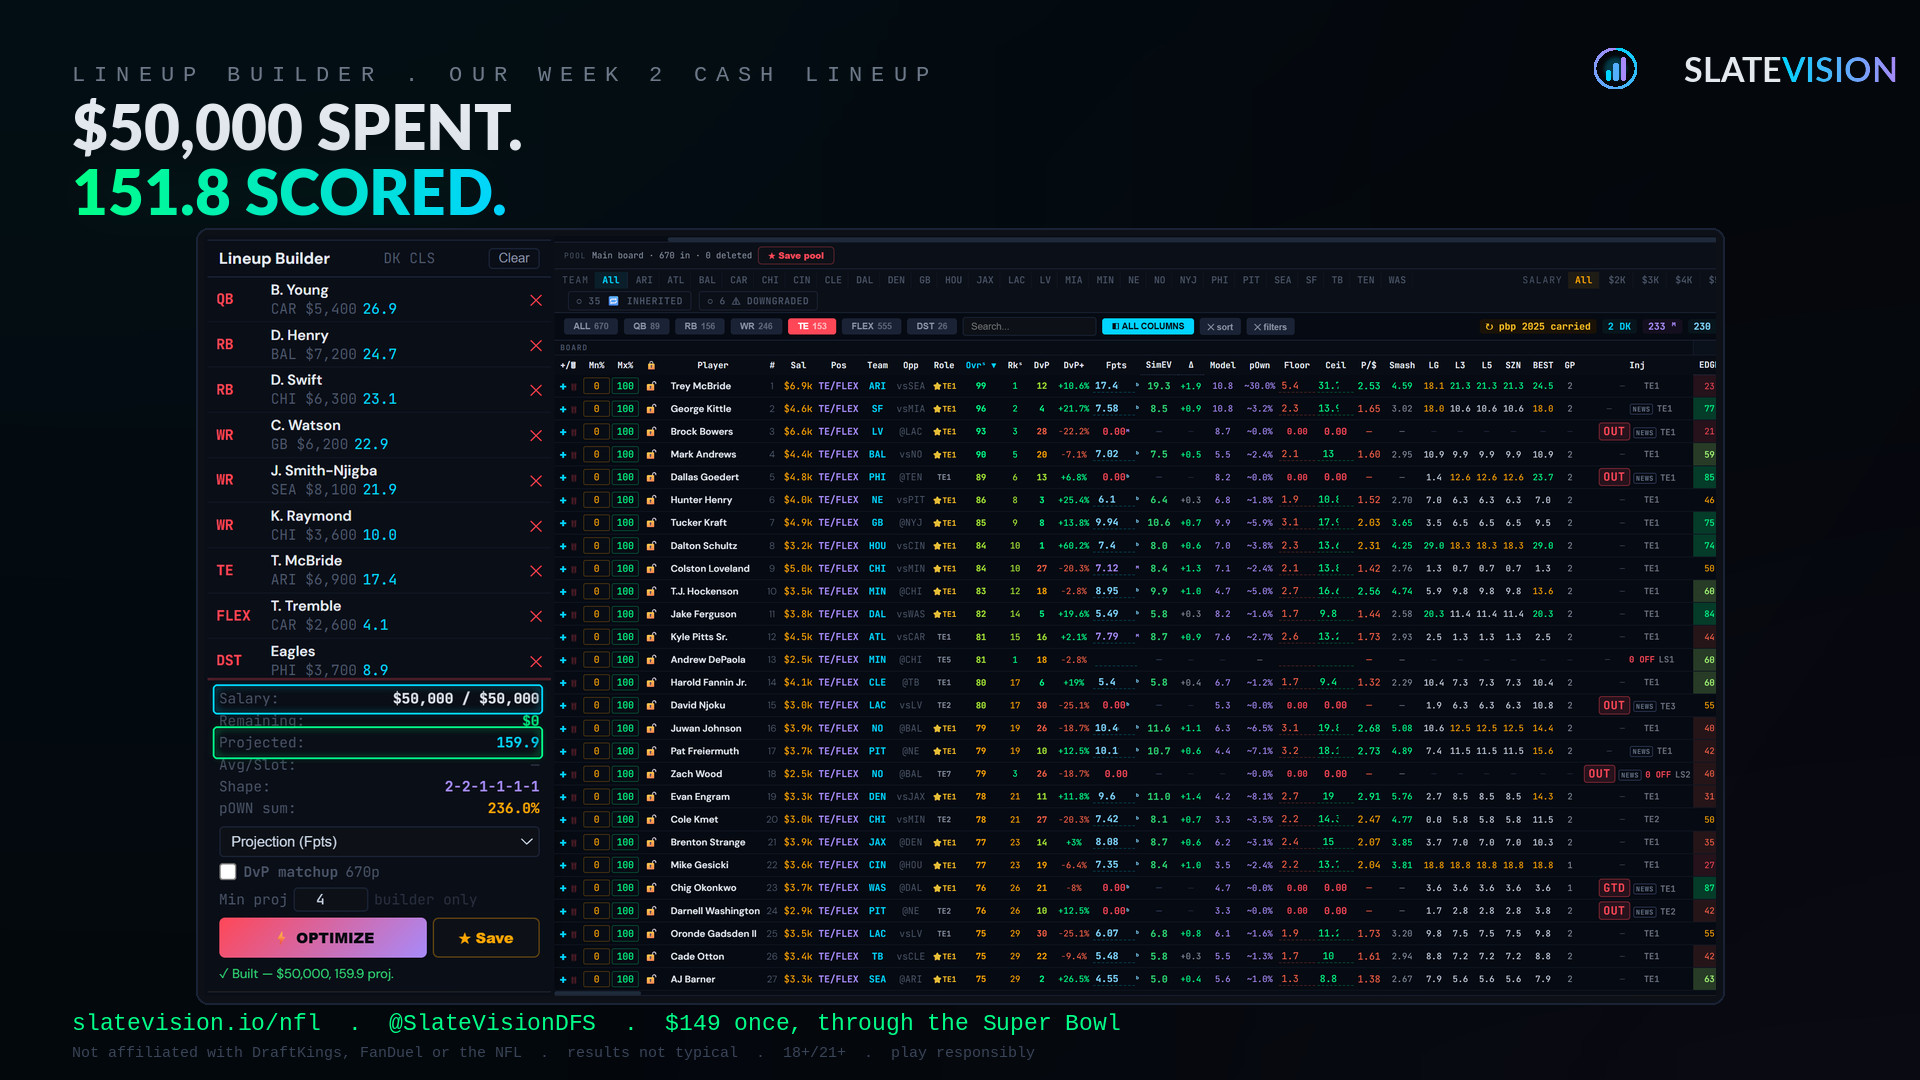
Lineup Builder, salary to the dollar, shape and pOWN sum — the panel you see on the desktop, on the phone. Tap Optimize and it runs on our machines, not yours.
Every column, still there
The board scrolls sideways with all 485 columns intact — sortable, colour-ranked, the same numbers. No "lite" mobile table with six fields on it.
Mass multi-entry, from a phone
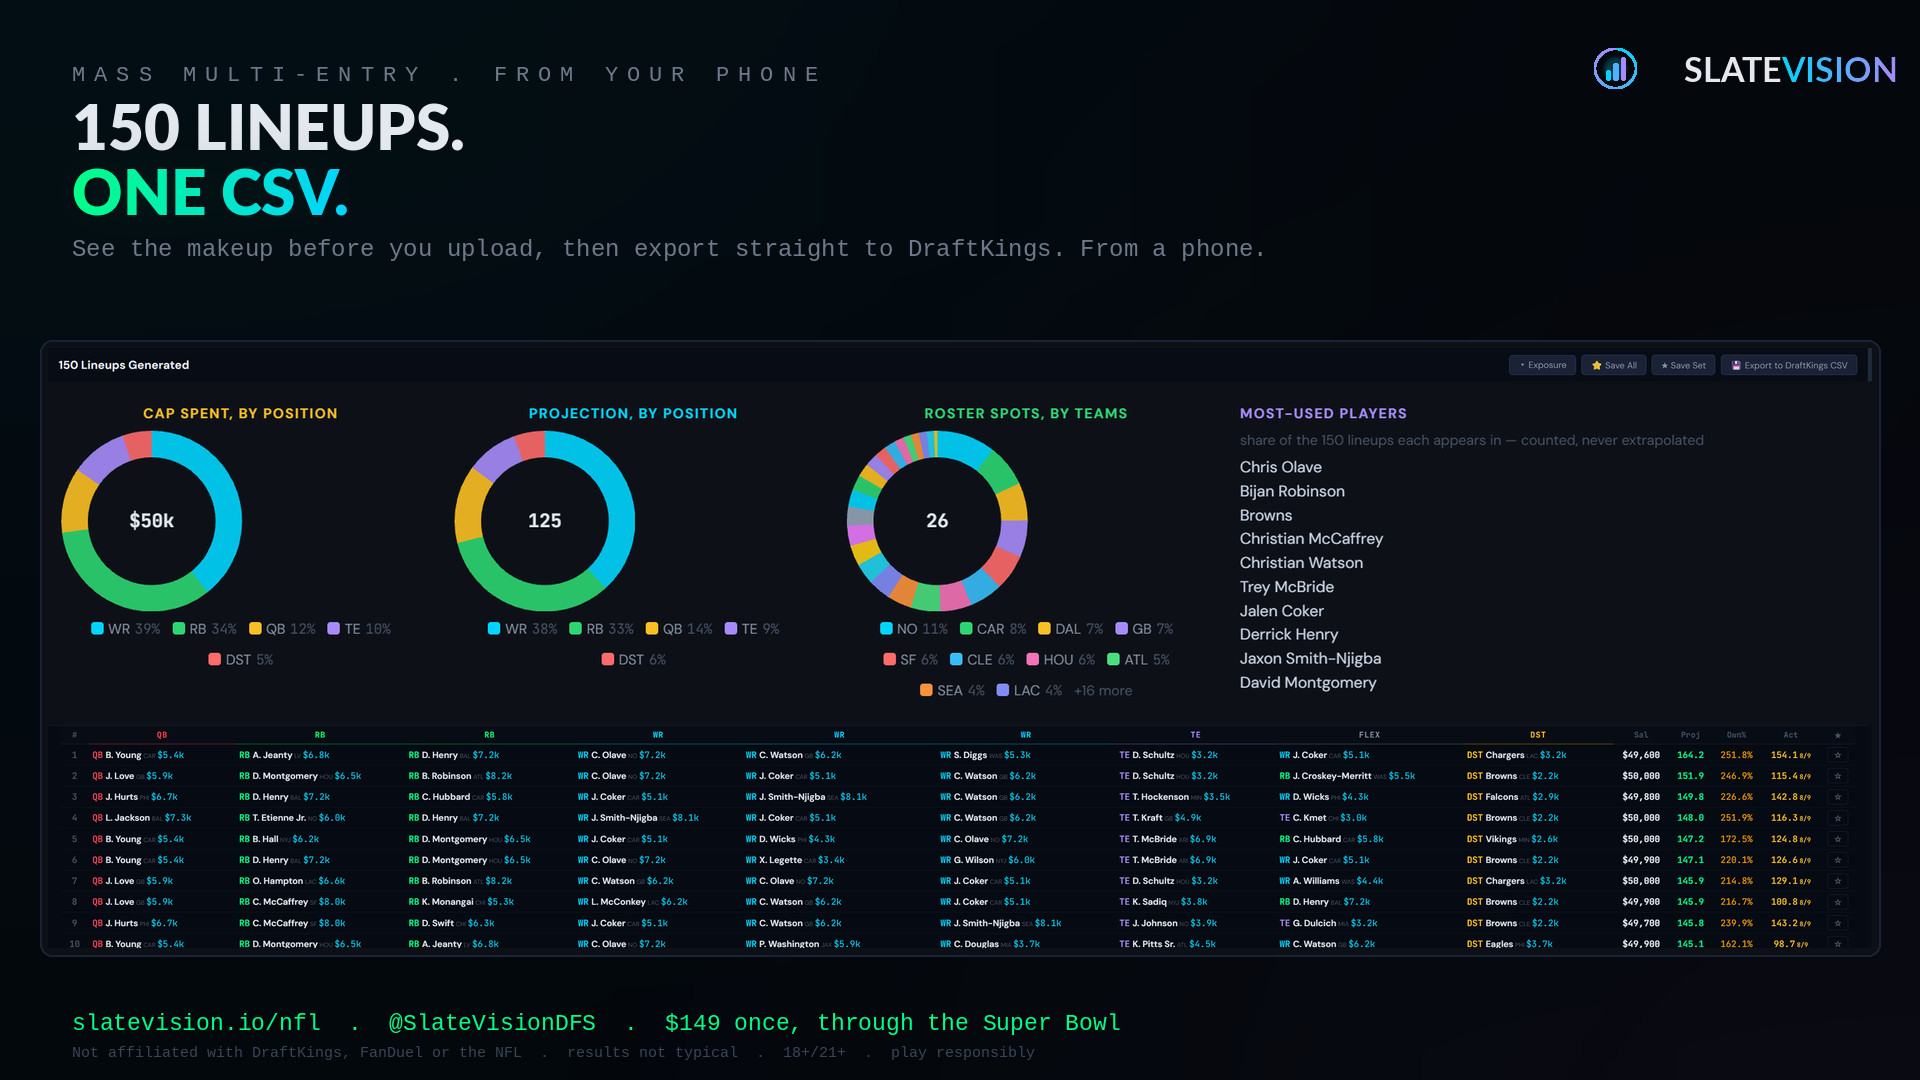
Build up to 500 lineups, read the makeup before you upload — cap spent, projection and roster spots by position and by team, plus player and team exposure across every lineup — then export the DraftKings CSV. All from the same browser tab.
This is the whole product. No mockups.
Every image below is a real screen from a real main slate — the 09-20 board, 13 games, 670 players. Click any one to open it full size.
Pricing
The NFL pass is one payment for the rest of the season — no subscription, nothing to cancel. Want the other four sports too? The all-sports plans sit beside it.
- ✓ Every NFL feature — all 26 tabs
- ✓ Change Stats, on every slate
- ✓ 100,000 sims per player
- ✓ DraftKings + FanDuel, classic + showdown
- ✓ One payment — not a subscription
- ✓ Nothing to cancel
- ✓ NFL · MLB · NBA · NHL · Soccer
- ✓ Every feature — no tiers
- ✓ DraftKings + FanDuel on all five
- ✓ Cancel yourself, any time, from the app
- ✓ All five sports, every feature
- ✓ Never lose your rate
- ✓ Priority on feature requests
Monthly plans cancel from inside the app at any time — Manage billing in the account bar opens the payment provider's own page. The NFL pass has no subscription attached and nothing to cancel.
The field is still reading season averages.
The rest of the regular season plus the playoffs, one payment, nothing to cancel — and the GPP case studies alone are worth the ticket.
GET THE NFL SEASON PASS — $149 See the track recordDisclaimers: SlateVision is analytics software for daily fantasy sports research. It is not a gambling service and does not accept or place wagers. No outcome or profit is guaranteed; past results are not typical and do not predict future performance. DFS involves financial risk; play responsibly and only where legal. You must be of legal age (18–21+ depending on region). Not affiliated with, endorsed by, or sponsored by DraftKings, FanDuel, the NFL, or any team or league. All trademarks are property of their respective owners. The NFL Season Pass is a one-time purchase granting NFL access through 15 February 2027; it is not a subscription and does not renew.
© 2026 SlateVision · slatevision.io · Terms · Privacy · support@slatevision.io